
Debugging
How to debug a web app made with WADE
We haven't had to do much debugging so far, because our WADE app is still really simple. However, you'll soon need some way of adding breakpoints, following your code step-by-step, inspecting variables, etc.
There are many ways to debug javascript code, and how to do it depends largely on the browser that you're using. It can be done with any browser, but for development I would suggest using Chrome, that ends up being slightly easier (although it needs that extra set up step to work with local files, as explained here).
The easiest (and lamest) way to see what your code is doing, is inserting alert statements in it, that will show a pop-up message with some text:
    var x = 12;
    alert("This code is being executed and variable x is " + x);
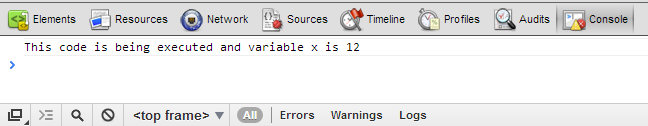
A slightly better way (though still lame) is to print messages to the console:
    var x = 12;
    console.log("This code is being executed and variable x is " + x);
Most browsers have a console that can be used for this purpose. In Chrome, press F12 (or Ctrl-Shift-I if you don't have an F12 key), and this will open the developer panel. There are many tabs at the top, and if you select Console you'll see something like this:
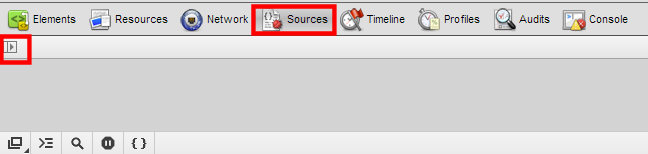
The advantage of this approach over alert is that it doesn't block the execution of your app. But you can do much better than this: if you click the Sources tab at the top of the developer panel, you'll see a list of scripts and resources that have been statically loaded; that is, scripts that are embedded in the page's html file. Note that you may have to expand the file list by clicking on the small icon in the top-left corner, as shown here:
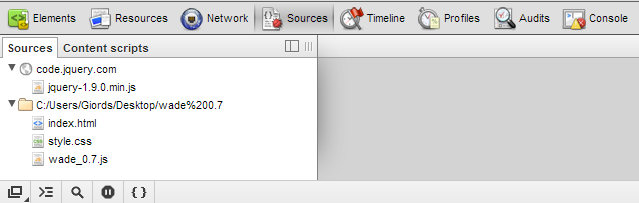
As you can see there is jquery.js and there is wade.js but, importantly, your main app file test.js is missing. This is because it was loaded dynamically, i.e. it was loaded by WADE at runtime. We need to tell Chrome about it, and we can do so by inserting a special comment right at the end of test.js, or any other file that we want to load dynamically with WADE:
//@ sourceURL=test.js
This will make our dynamically loaded file appear in the list of source files, and we can then interact with it by double clicking it, then setting breakpoints, looking at variables in the panel on the right-hand side, and so on.
A full explanation of all the features of the Chrome developer panel is well beyond the scope of this tutorial. It's fairly intuitive stuff and you'll naturally learn as you go along, but if you want to know all about it, you can read the documentation provided by Google.

